This guide is for scenario planning on Overview (and similar views). Your projections refresh when you save changes to income, so you can adjust and watch the charts respond.
Step 1: Open income from the control panel
The wallet icon in the control panel (the row under the main tabs) is where you add or update income.
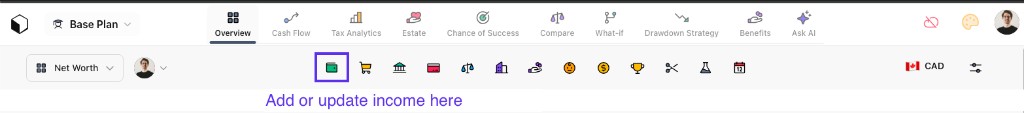
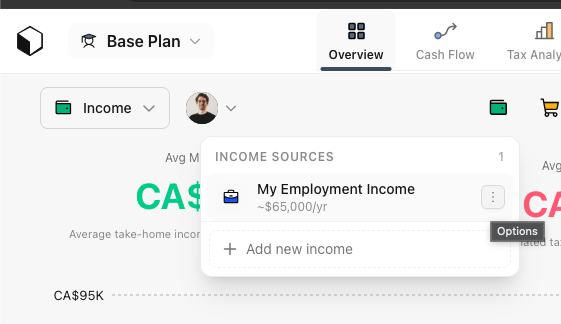
Tap the wallet to open Income sources.
- Click a row (for example My employment income) to open the full editor right away. That is the fastest path to edit.
- Use + Add new income when you want another line from scratch.
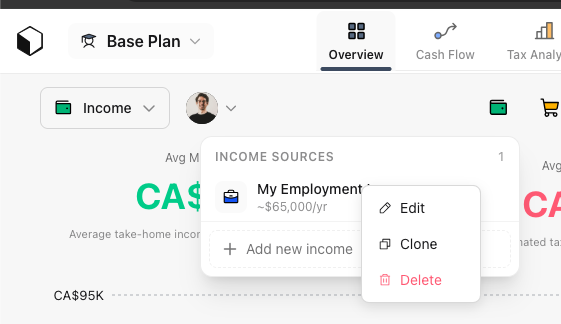
- Clone and delete are only in the row menu. Select ⋯ (Options) on the right of the row, then Edit, Clone, or Delete. Edit there does the same thing as clicking the row.
Step 2: Choose an income category
The modal starts with Select income category. Use Scenario region next to the title to match the grid you see in the app for your scenario. One choice applies to the whole page. More regions will appear in that control as they are supported. Each tile has a short help hint (the ? icon) if you want definitions without leaving the flow.
Includes employment, self-employment, investment and rental income, pension, CPP, OAS, GIS, allowances, RRSP and TFSA withdrawals, and other income.
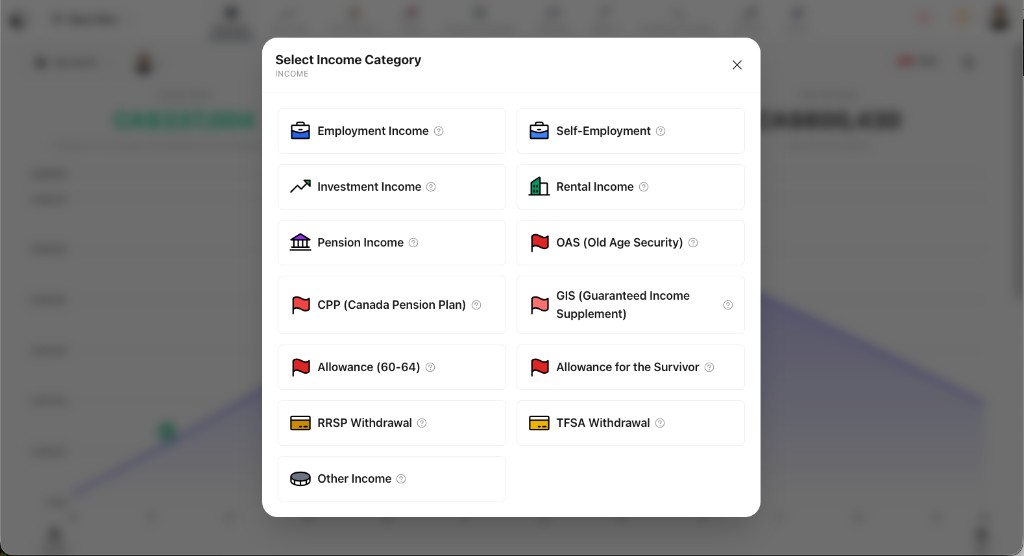
The pattern is similar everywhere: employment-style work, investment and property flows, retirement and public benefits, registered or tax-advantaged withdrawals where they apply, and other as a catch-all.
Pick the category that best matches the cash flow. You can change it later by editing the same income.
Step 3: Amount, frequency, and timing
For almost every income type you will set:
- Amount (gross for income, in the frequency you choose)
- Frequency, such as monthly, yearly, bi-weekly, weekly, or one-time
- When it starts and ends, often tied to ages, dates, or milestones you have defined in the scenario
One-time items behave differently from recurring ones (for example growth options may not apply). Use the controls in the modal to match how the money actually shows up in real life.
Example: employment income editor
After you choose Employment income, you see an editor like this (your title may differ, for example My employment income):
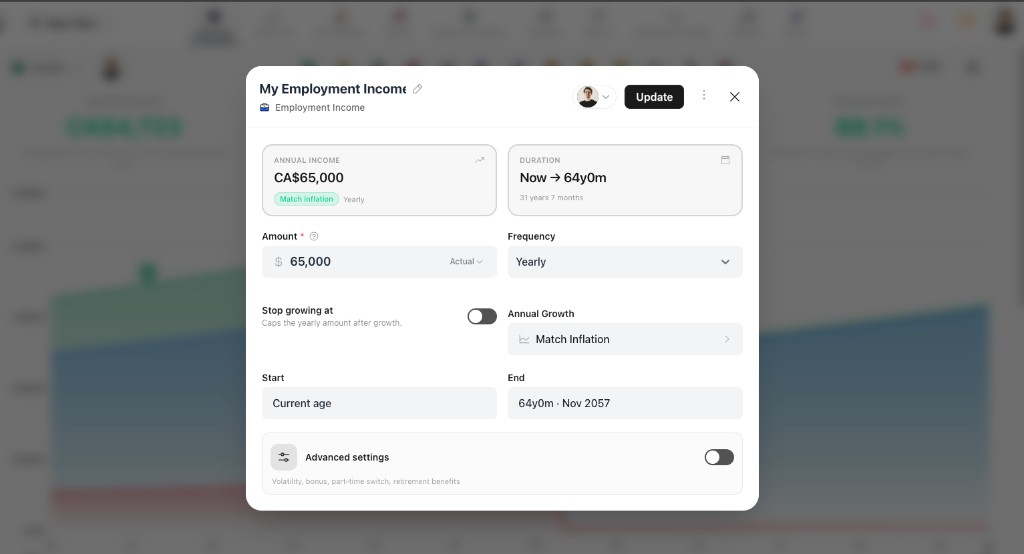
Header and actions
- Title (with edit where offered): your label for this income in lists and charts.
- Category badge: confirms Employment income.
- Household / profile control (when shown): who earns this.
- Update saves your changes. ⋯ and × are the usual more-actions and close controls.
Summary cards
- Annual income: quick read of yearly pay, frequency (for example Yearly), and the growth mode (for example Match inflation).
- Duration: Start → End in plan ages plus total span, so you can confirm working years at a glance.
Amount and basis (Actual vs Today's)
The amount field is required. The small control at the end of that field switches how the number is interpreted:
- Actual: Nominal dollars for the year context of this income (what you would type from a payslip or contract for that timing). The projection uses this nominal path unless you change basis.
- Today's: The same economic income expressed in plan start purchasing power, using your scenario inflation assumption. Use this when you want to think in “money as of the first projection year” and let the app convert to nominal for the engine. When you flip the control, the figure updates so the two views stay consistent under your assumptions.
If inflation or the relevant year inputs are not available yet, switching may not change the number until those are set.
Frequency and growth
- Frequency: How often the amount repeats (Yearly, Monthly, Bi-weekly, Weekly, One-time, and so on).
- Stop growing at: Optional cap so pay raises do not run without a ceiling (the hint explains it caps the yearly amount after growth steps).
- Annual growth: For example Match inflation or another pattern so income can rise over the career.
Start and end
- Start: Often Current age or a specific age, date, or milestone.
- End: When employment income stops (for example a retirement age with a calendar readout).
Advanced settings (employment)
Leave Advanced settings off for a simple salary line. Turn it on when you need the extra sections hinted under the toggle:
- Volatility: Model variability or risk in pay instead of a single fixed track.
- Bonus: Add or tune bonus pay on top of base, when your plan exposes it.
- Part-time switch: Change hours or pay at a milestone (for example phased retirement).
- Retirement benefits: Employer retirement or pension-related inputs when your plan and Scenario region include them.
- Equity or RSU-style pay: On some plans, stock or option style compensation appears as its own block inside Advanced.
What you see can depend on plan tier and category. If a row from the hint is missing, it may not apply to your subscription or region yet.
Step 4: Source, links, and ownership
Depending on category and what you have modeled, you may also see:
- Source (personal vs entity): if you use structures (for example a holding company), some incomes can be assigned to a structure instead of personal
- Links to accounts or debts: some flows can be tied to a specific asset or liability so the engine keeps the story consistent (for example investment or rental context)
- Household ownership (for example primary vs spouse) where your scenario supports it, so taxes and splits stay correct
If a field does not apply, you can usually leave it at the default.
Step 5: Advanced on other income types
For categories other than employment, Advanced still appears when the modal has more than base amount and timing. Typical themes include volatility, tax treatment, source entity, or category-specific rules. The employment example above shows the richest layout; other tiles are often shorter.
You do not need to fill every advanced field on day one. Add detail when you are calibrating a scenario.
Step 6: Save, edit, or remove
Save applies the income to the scenario. Projections update in real time after the save completes.
To change something later, open the wallet icon again, select the line, and edit. To delete an income you no longer want, use the delete action from the list or detail flow (wording may vary slightly by screen).
View income and taxes over time
Stay on Overview (the default main tab for your scenario). In the second row under the tabs, open the chart type control on the left (it may read Net Worth by default) and switch it to Income. That is a chart mode, separate from the wallet icon row you use to edit income lines.
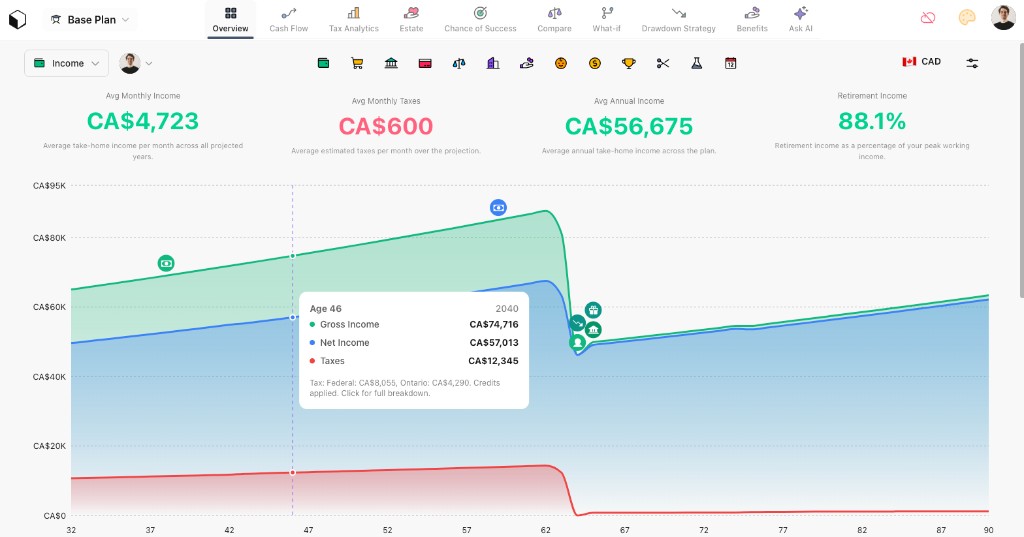
The chart is a time series across ages: gross income, net (take-home) income, and taxes as stacked areas so you can see how pay and withholding evolve through work and retirement. The summary tiles above average monthly and annual figures and related stats (exact labels depend on your data).
Move along the chart to read the tooltip for a given age and year. It shows gross, net, and taxes for that point, and a short jurisdiction line (for example federal plus provincial or state tax, credits applied, and a prompt to open the full breakdown when available).
Related
- Scenario assumptions for tax residency, inflation, growth, and defaults that sit alongside income
- Create your first scenario in a minute if you have not set up a scenario yet
- More focused guides (for example expenses, linked assets, or milestones) can link here the same way as your library grows
Questions? Use Help in the app or visit the Help Center.