This walkthrough assumes you’re signed in. You’ll end with a working scenario and a first look at your projections.
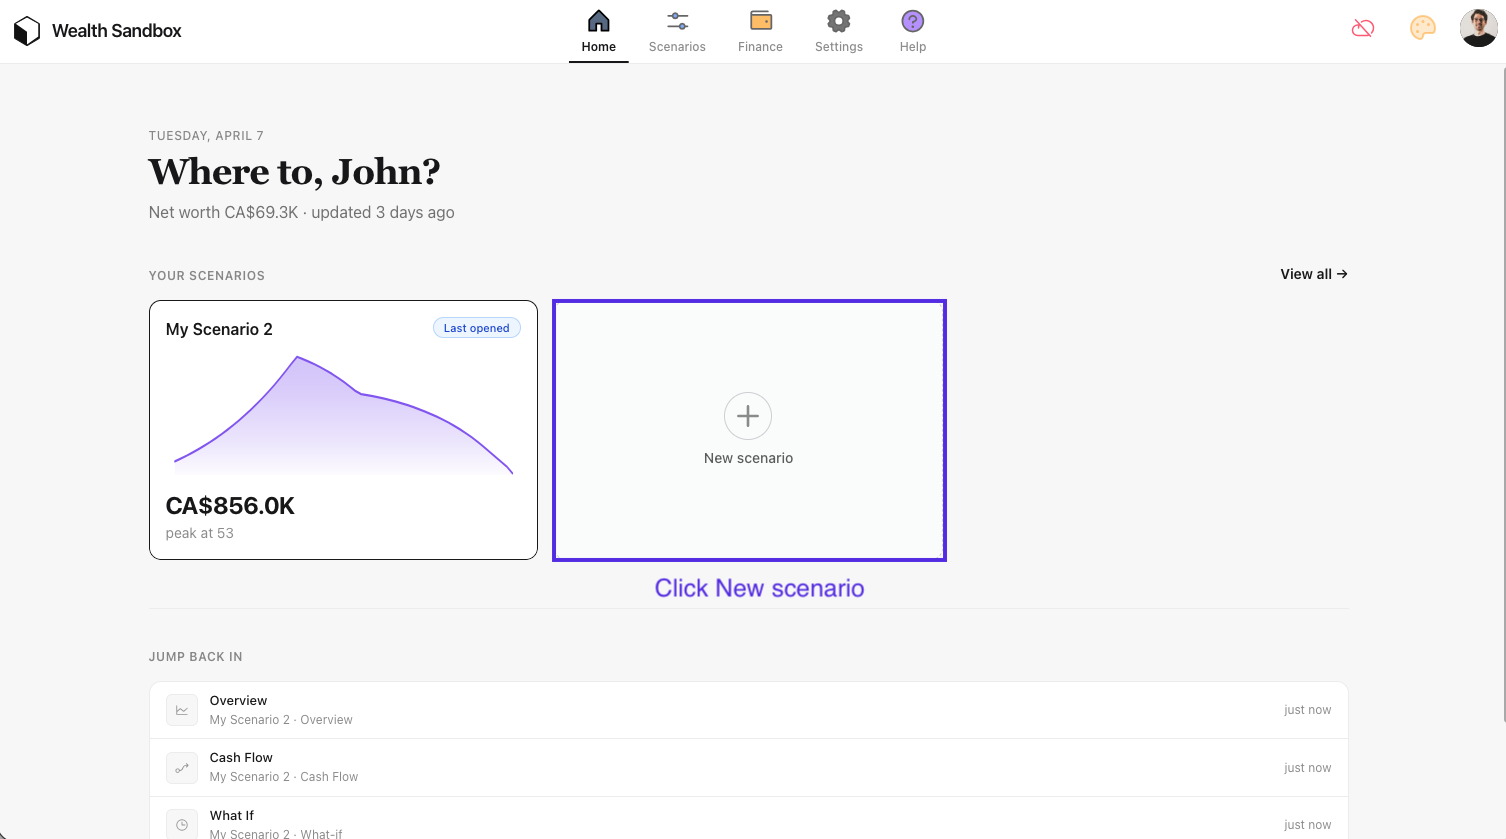
Step 1: Open New scenario from Home
On Home, under Your scenarios, choose the card with the plus icon and New scenario.
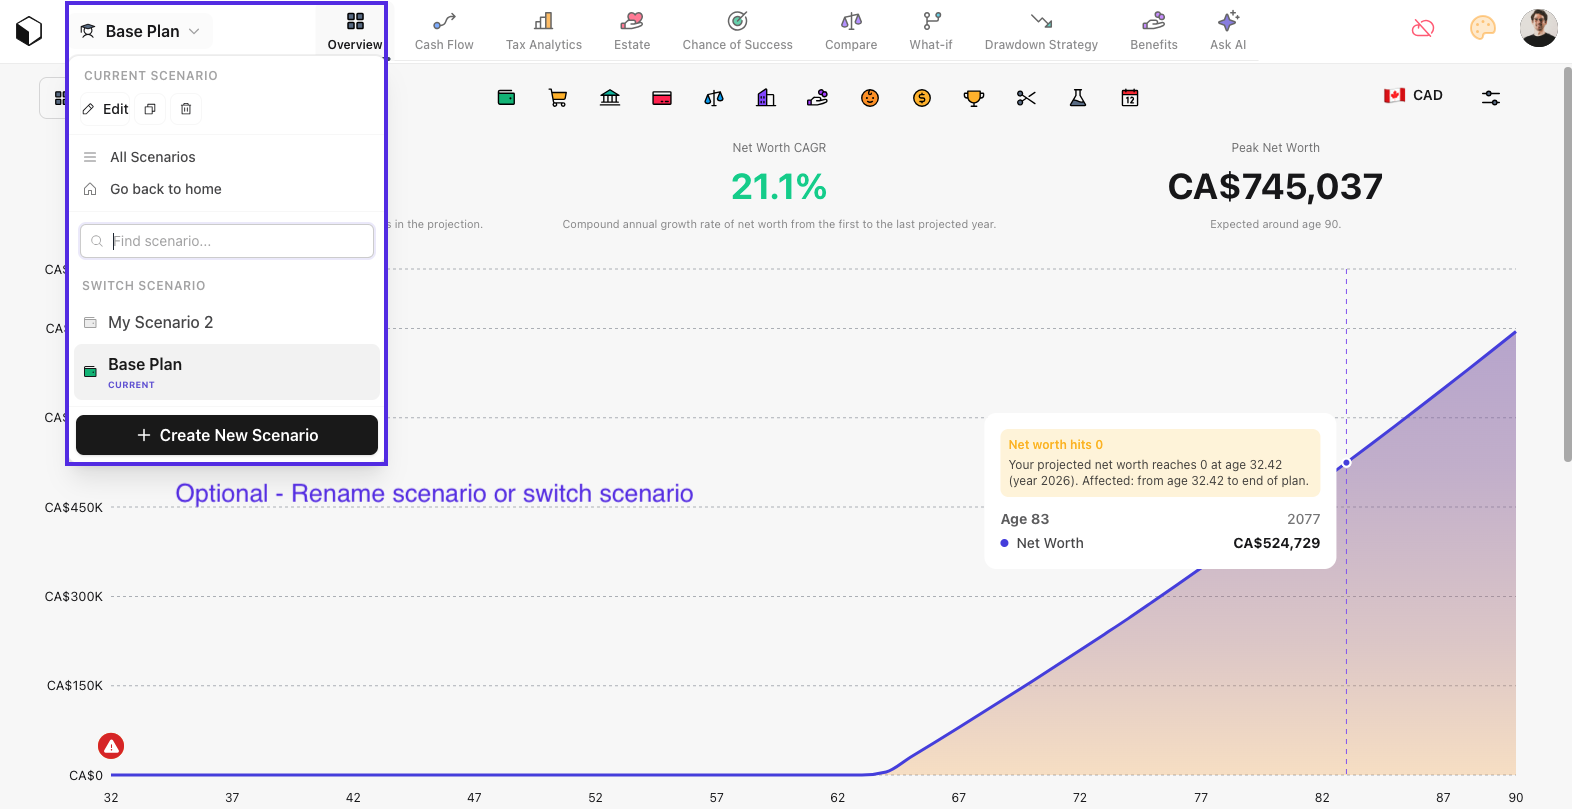
Step 2: (Optional) Scenario menu: rename, switch, and more
On Overview (and similar views), click the scenario name at the top (e.g. “Base Plan”) to open the scenario menu. From there you can:
- Edit to change the name and icon
- Clone or delete the current scenario
- Go to All scenarios or back to Home
- Search and switch to another scenario
- Create new scenario
This whole step is optional if you’re happy with the default. You can close the menu and continue.
If you’re still in a setup flow or template picker after creating the scenario, finish that first. Then you’ll reach Overview where this menu is available.
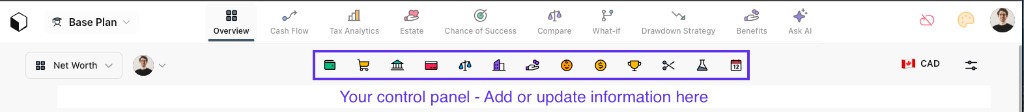
Step 3: Enter the basics
On Overview, use the control panel (the row of icons under the main tabs) to open each area and fill things in.
Add the core fields your app asks for, typically age, planning horizon (or life expectancy), country, and household settings. These drive tax and benefit rules in projections.
Step 4: Add a minimal financial picture
Use the same control panel for money inputs. You don’t need everything on day one. Start with:
- One or two accounts (e.g. cash + one investment account)
- One income (salary or main source; see add and update income)
- Core expenses (housing, living costs at a rough monthly total)
Save or continue as the flow prompts. The goal is enough data for charts to appear.
Step 5: View your projections
Open the scenario’s overview or projection views. You should see net worth over time and related charts: summary numbers above the chart and the curve across your planning horizon. Markers on the line often line up with incomes, expenses, or other events you have modeled.
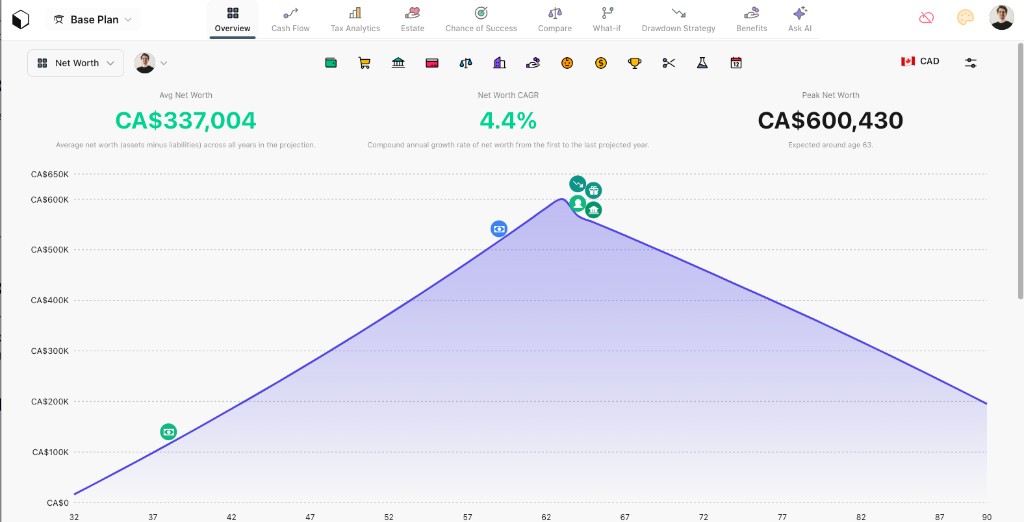
Projections update in real time whenever you save or update something, so you can iterate without leaving the page. Try changing one assumption and watch how the shape of the curve responds. That’s the core loop of scenario planning.
Next steps
- Duplicate or branch the scenario to try a what-if (e.g. different retirement age).
- Explore tax or cash flow views if your plan includes them.
- When you’re ready, add more accounts, milestones, and detail to tighten the model.
Questions? Use Help in the app or visit the Help Center.